Celebrating Our Fifth Consecutive GovTech 100 Win
We are thrilled to announce that we have been named to the GovTech 100 list
The 2016 U.S. Presidential Election left people on both sides of the political aisle very surprised. Many media outlets, pollsters and political predictors hadn’t seen it coming. Since then, several articles have investigated the relative shock of the election using the frameworks of social media bubbles, news bubbles and socio-economic/racial bubbles.
Here, I will discuss a similar framework called migratory bubbles. As a Texan living in San Francisco, people often tell me they would move to Texas, “but only Austin!” They see a parallel liberal haven and would feel comfortable moving there.
This desire to move somewhere politically similar is only anecdote, but I want to see whether it’s indicative of a wide-ranging phenomenon that we act upon when moving to a new city.
Do people living in liberal places move to liberal places? Do people living in conservative places move to conservative places? Or is there a large degree of mixed political dispersal? How insular are our migratory bubbles?
Regional Migratory Bubbles
To begin answering these questions, I obtained a few datasets: the most recent U.S. County-to-County migration outflows (2010-2014), and LotaData’s Geo-Political County Level dataset. LotaData provided county shapefiles, county demographics and county vote information over the past 3 national Congressional and Presidential elections (2012, 2014, 2016).
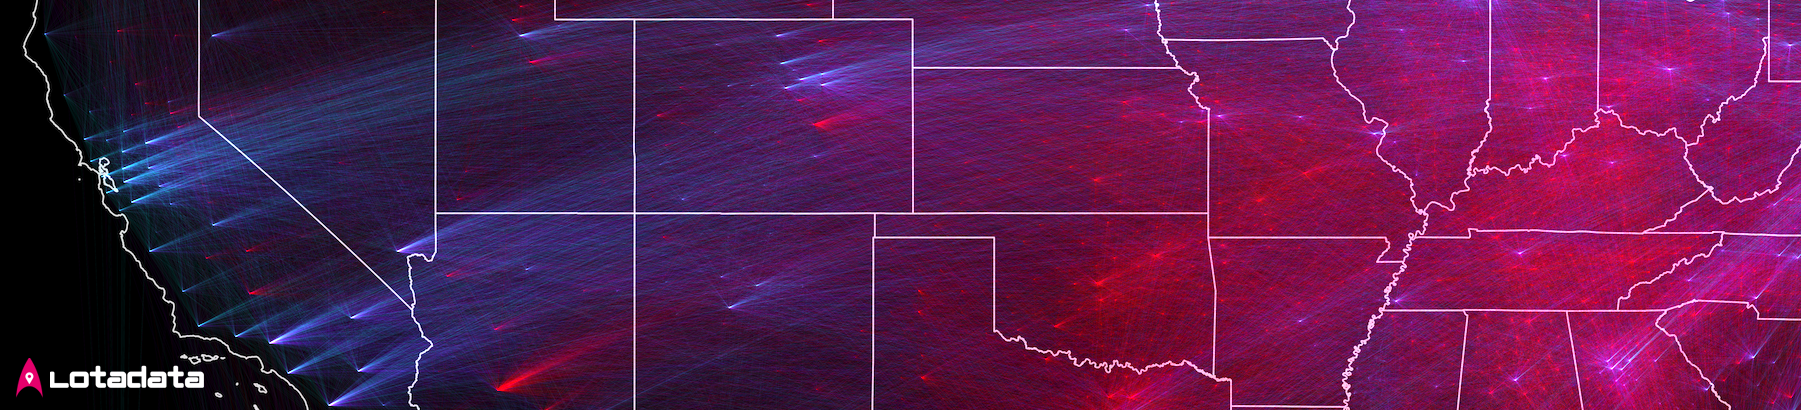
To visualize the data, I combined the datasets by county id, then mapped the results by Census-defined region. On the map below, each migratory arc connects a previous county of residence with a current county of residence. Larger county-to-county migration flows are represented by larger arcs.

Figure 1: Regional migratory arcs colored by Census region:
West (red), Midwest (yellow), Northeast (green) and South (cyan)
Each arc is then colored according to the region of the county of final residence. For this map, the West is red, the Midwest is yellow, the Northeast is green and the South is cyan.
The resulting map has one major takeaway: most migration is intra-regional. Only a few areas, like the aqua-marine of Southern Florida or the red-yellow split of Milwaukee, have a significant amount of inter-regional migration.
In some sense, this is our first order bubble. When moving to new places, we stay close to previous homes. It’s often what makes the most sense from an economical and social perspective.
Political Migratory Bubbles
The existence of intra-regional migratory bubbles is an interesting insight, but how does this fact inform our political migratory bubbles? Within these Census defined regions, 538 has shown that political leanings are highly correlated (particularly so in the Midwest). Since we often move only within our own region and our region’s politics are highly correlated, we should expect that most people are also moving between politically similar places.
What we do when we leave our region, however, is a little less clear. The map below takes away some of the previous map’s noise by focusing on one region at a time. It gives us the inter- and intra-regional views, while shading the map to show political affiliations.

Figure 2: Political migratory arcs colored by county political affiliation:
R→R = red, R←→D = purple, D→D = blue
Each arc here is colored according to the political leanings of the counties involved. If D is a Democratic County and R is a Republican County, this is the formula for coloring:
R→R = red
R→D = purple
D→R = purple
D→D = blue
Looking again at the map, the most notable and colorful political features are (1) the broad swaths of red underlying matrices (2) the numerous blue cross-country arcs and (3) the glowing blue Eastern seaboard of Boston, New York City, and Washington D.C.
At a glance, these arcs help reveal the growing urban vs. rural divide already noted in other analyses. The maps also lend credence to the existence of flyover states and coastal elites in county-to-county migration. While there is a significant amount of coast to coast movement, and interior to interior movement, the coast to interior movement (& vice versa) is limited.
Migratory Bubbles: By the Numbers
Getting down into the data, we can start to see whether certain regions are better/worse than the national average at getting out of their bubbles. In the chart below, we find that 31% of U.S. migration occurred from R→R, and 32% occurred from D→D. This shows that nearly 2/3 of all migration occurred within political bubbles on each side of the political spectrum.

Figure 3: Percent of Political Migration Type by Region
(e.g. 55% of MW migration is R→R)
More than 50% of all people from the West and Northeast migrated from a liberal county to another liberal county.
About 40% of all people from the South and Midwest migrated from a conservative county to another conservative county.
These are the two dominant versions and visions of the U.S: the Southern/Midwestern Republican base (flyover country) and the Western/Northeastern base (coastal elites).
The causes for these migratory political bubbles are likely twofold and may even have relatively little to do with politics: (1) It is a function of jobs. Urban places are likely to be liberal and urban job seekers likely find similar new jobs or homes in other urban (i.e. liberal) environments. The same logic follows for rural jobs and conservative places. (2) People move close to where they used to live, and due to intra-region political correlation, this tends to be an intra-political-bubble move as well.
It seems that when moving to new cities, we do in fact tend to stay within our own bubbles. People living in liberal places are more insular in their migration at this level of analysis.
In order to conclude this more rigorously, however, a finer level of analysis ought to be applied. To improve future analysis, the magnitude of political change should be considered and more granular data should be used.
Nevertheless, if you have the luxury of planning out your next move, consider how divided we have become as a nation. Actively moving toward politically integrated communities could be an important to step to healing our nation’s divides.