
Mobility Trip Patterns for Greater New York Metro Region
> This blog posts delves into the mobility data and trip hop movement patterns for one of the largest metropolitan regions in the United States. > Sign up for our webinars to learn
A collection of 21 posts
> This blog posts delves into the mobility data and trip hop movement patterns for one of the largest metropolitan regions in the United States. > Sign up for our webinars to learn
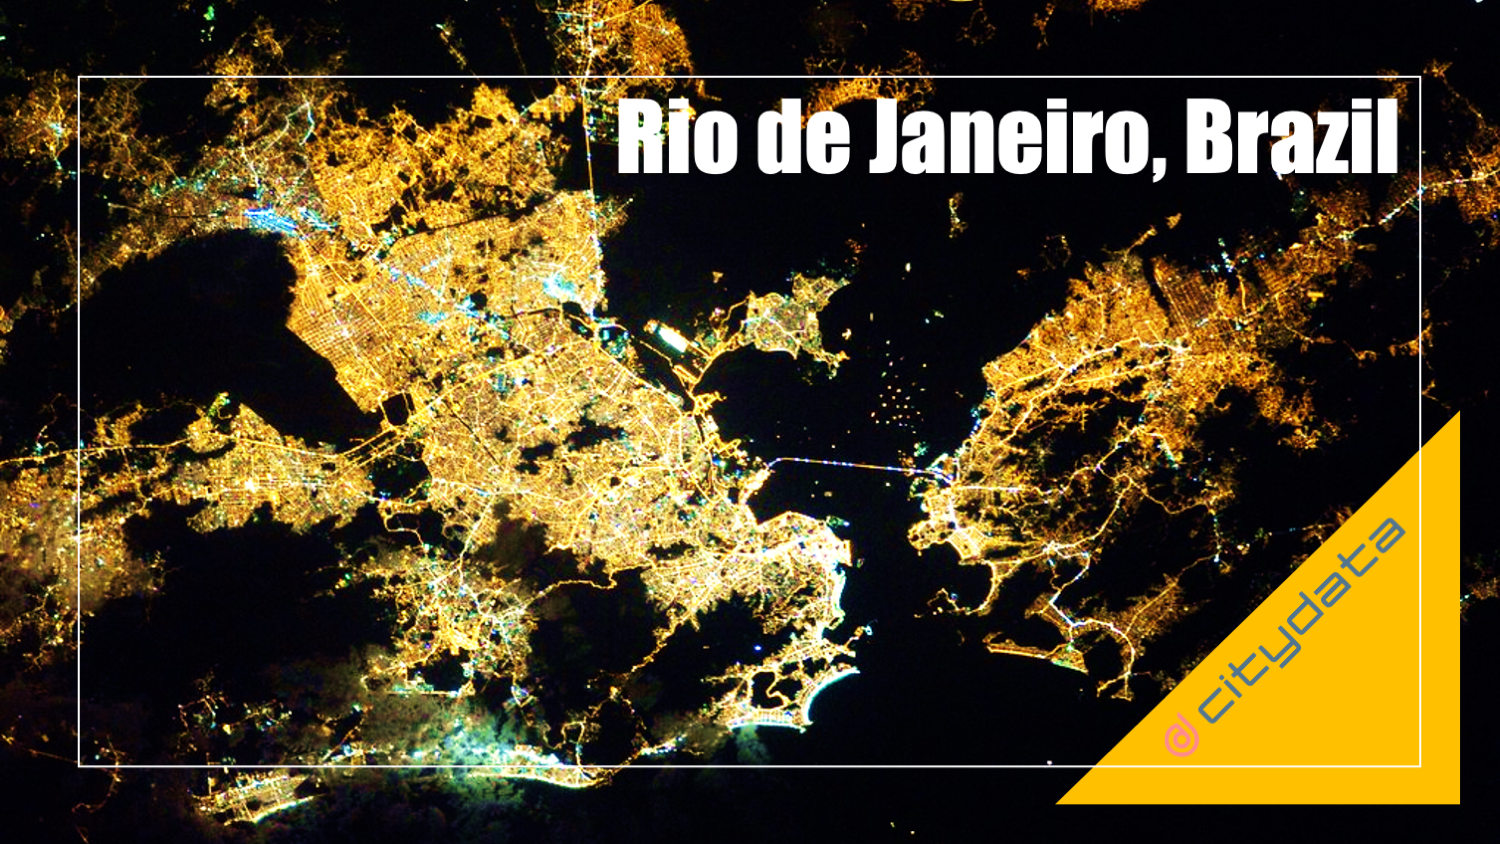
> This blog posts delves into the mobility data and trip hop movement patterns for one of the largest metropolitan regions in Brazil. > Sign up for our webinars to learn from our

> This blog post highlights the top-100 exemplary companies that raised the bar for technology innovation for local and regional government, and devoted their energies to the greater good in 2021. > Sign

> This blog posts delves into the mobility data and trip hop movement patterns for the largest metropolitan regions in Texas and the largest metropolitan region in India. > Sign up for our

Citywide data insights dashboard spanning four departments and seven datasets for the City of San Leandro, California, USA CITYDATA.ai [http://citydata.ai/] has designed and developed a unified data analytics dashboard called
> This blog posts delves into the mobility data and trip hop movement patterns for one of the largest metropolitan regions in the United States. > Sign up for our webinars to learn
The Data for Humanity initiative helps government agencies & health researchers with people movement analysis and geospatial dashboards related to COVID-19.
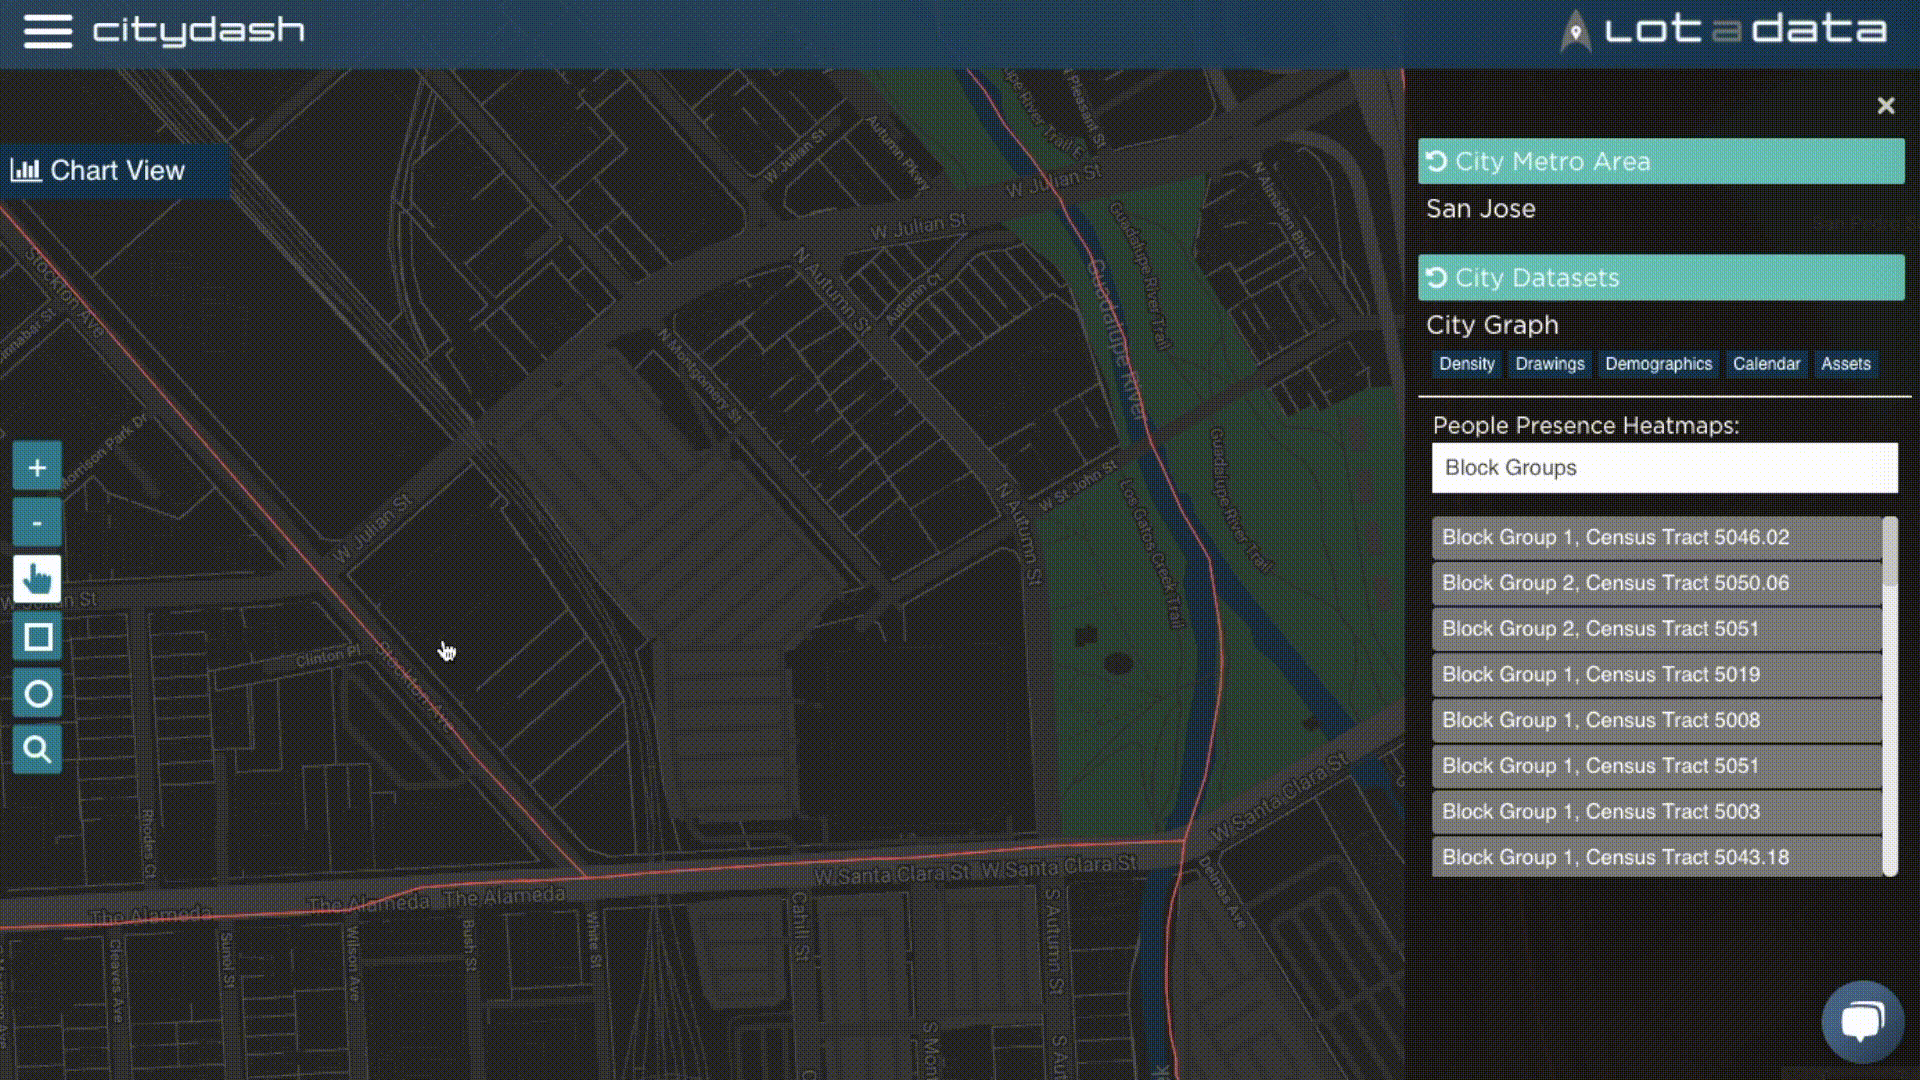
Break into the top 20 with Cheat Code #19. This awesome shortcut will uplevel your dashboard skills and turn you into a geospatial pro! As you know already, CityDash.ai is the ultimate
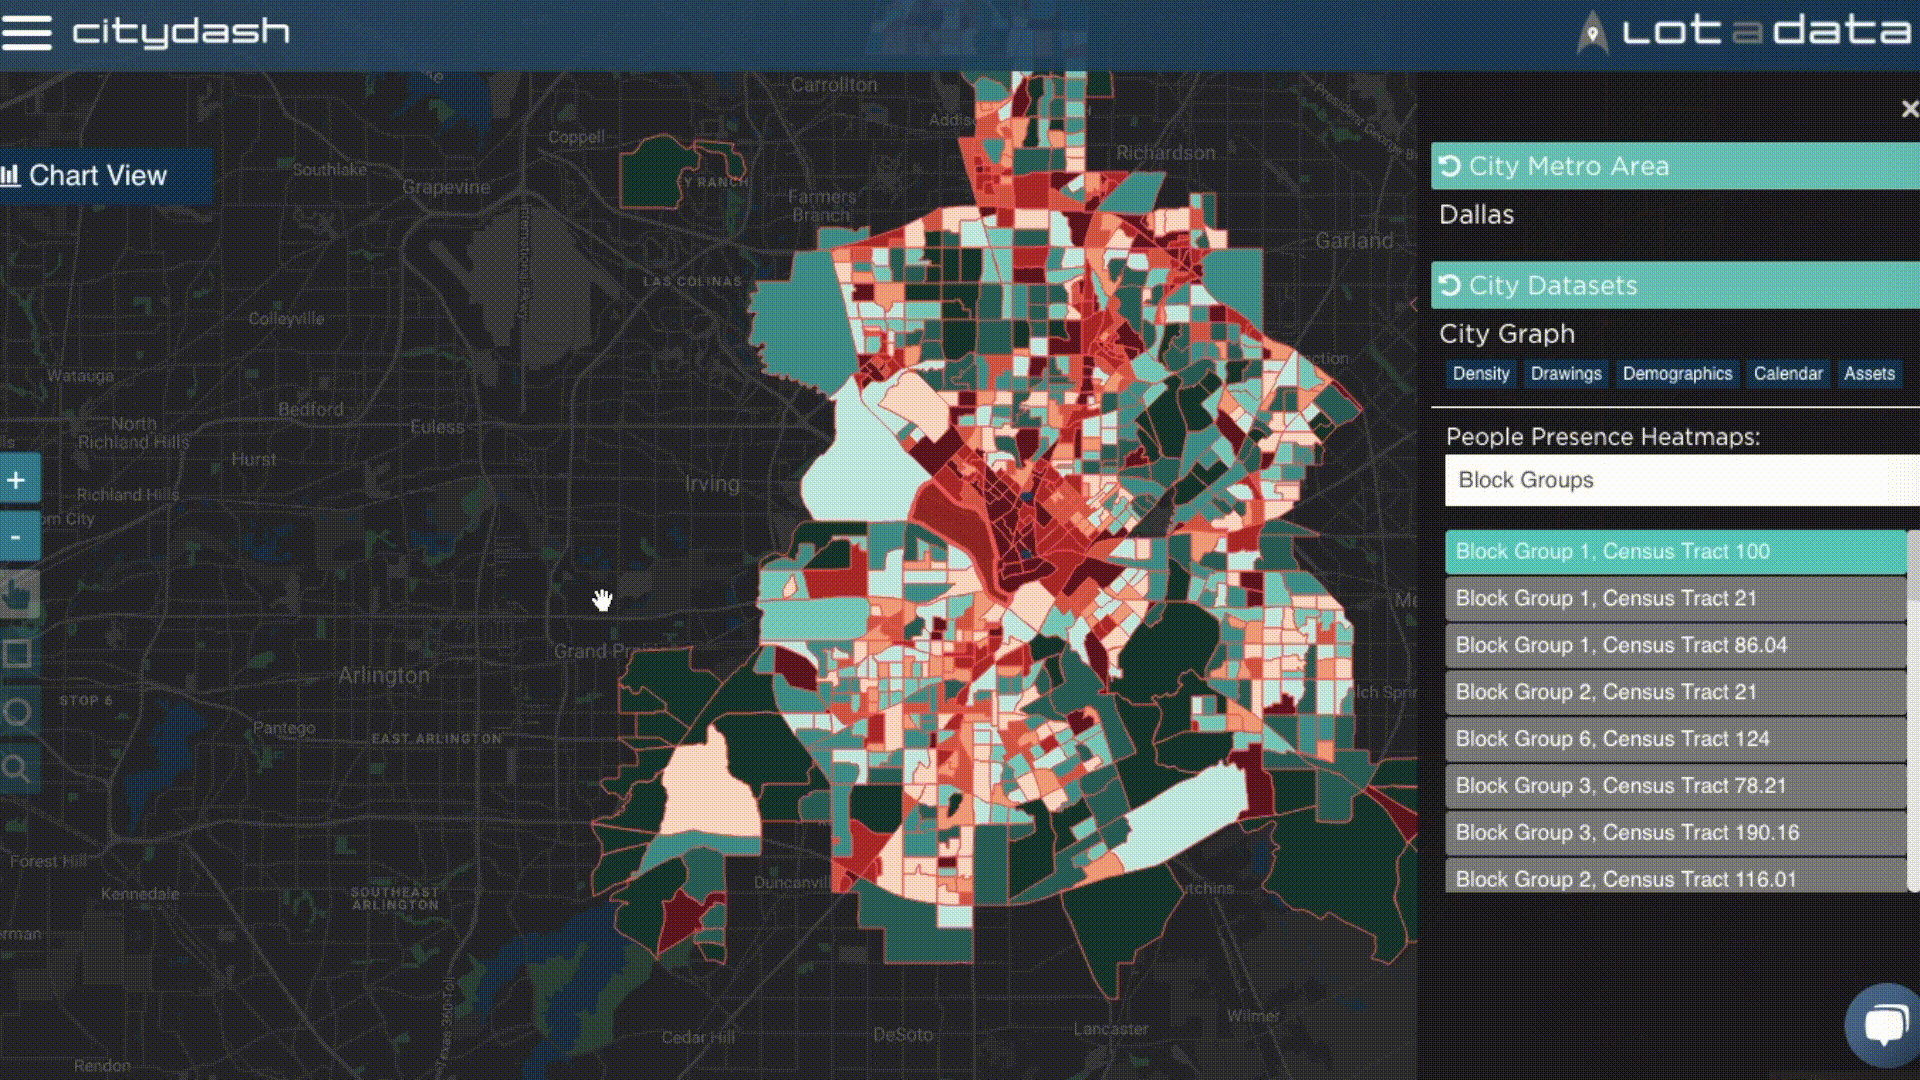
CityDash.ai is the ultimate platform for anonymized and aggregated daily data insights about people presence, activity, and movement for every block and every neighborhood in your city. But did you know that