When the going gets tough, Camels outlast Unicorns
The Bactrian Camel isn't pretty to the conventional eye. With two oddly large
Data is to smart cities as water is to life. The pandemic has accelerated the adoption of data in the public sector, forcing an immediate transition from legacy software to SaaS, cloud, big data analytics, and workflow automation.
Cities produce a significant amount of data exhaust. Rapid digital transformation is generating even more data. The new normal is powered by multilingual chatbots, mobile apps, smart IoT sensors, virtual meetings, online town halls, and citizen engagement through social media. The deluge of big data appears to have created a 'water, water everywhere but not a drop to drink' moment for local government. Cities are in need of tools, skills, budgets to curate these massive datasets, and then analyze, correlate, visualize and make the data actionable.
"Cities are drowning in big data with no easy answers. This presents an urgent opportunity for data + Ai companies like CITYDATA to become the chief data officer in the cloud for cities on a budget. Our ability to infer impactful insights from massive datasets to improve resident services is making a big difference for local government agencies," said Apurva 'Apu' Kumar, CEO of CITYDATA.ai
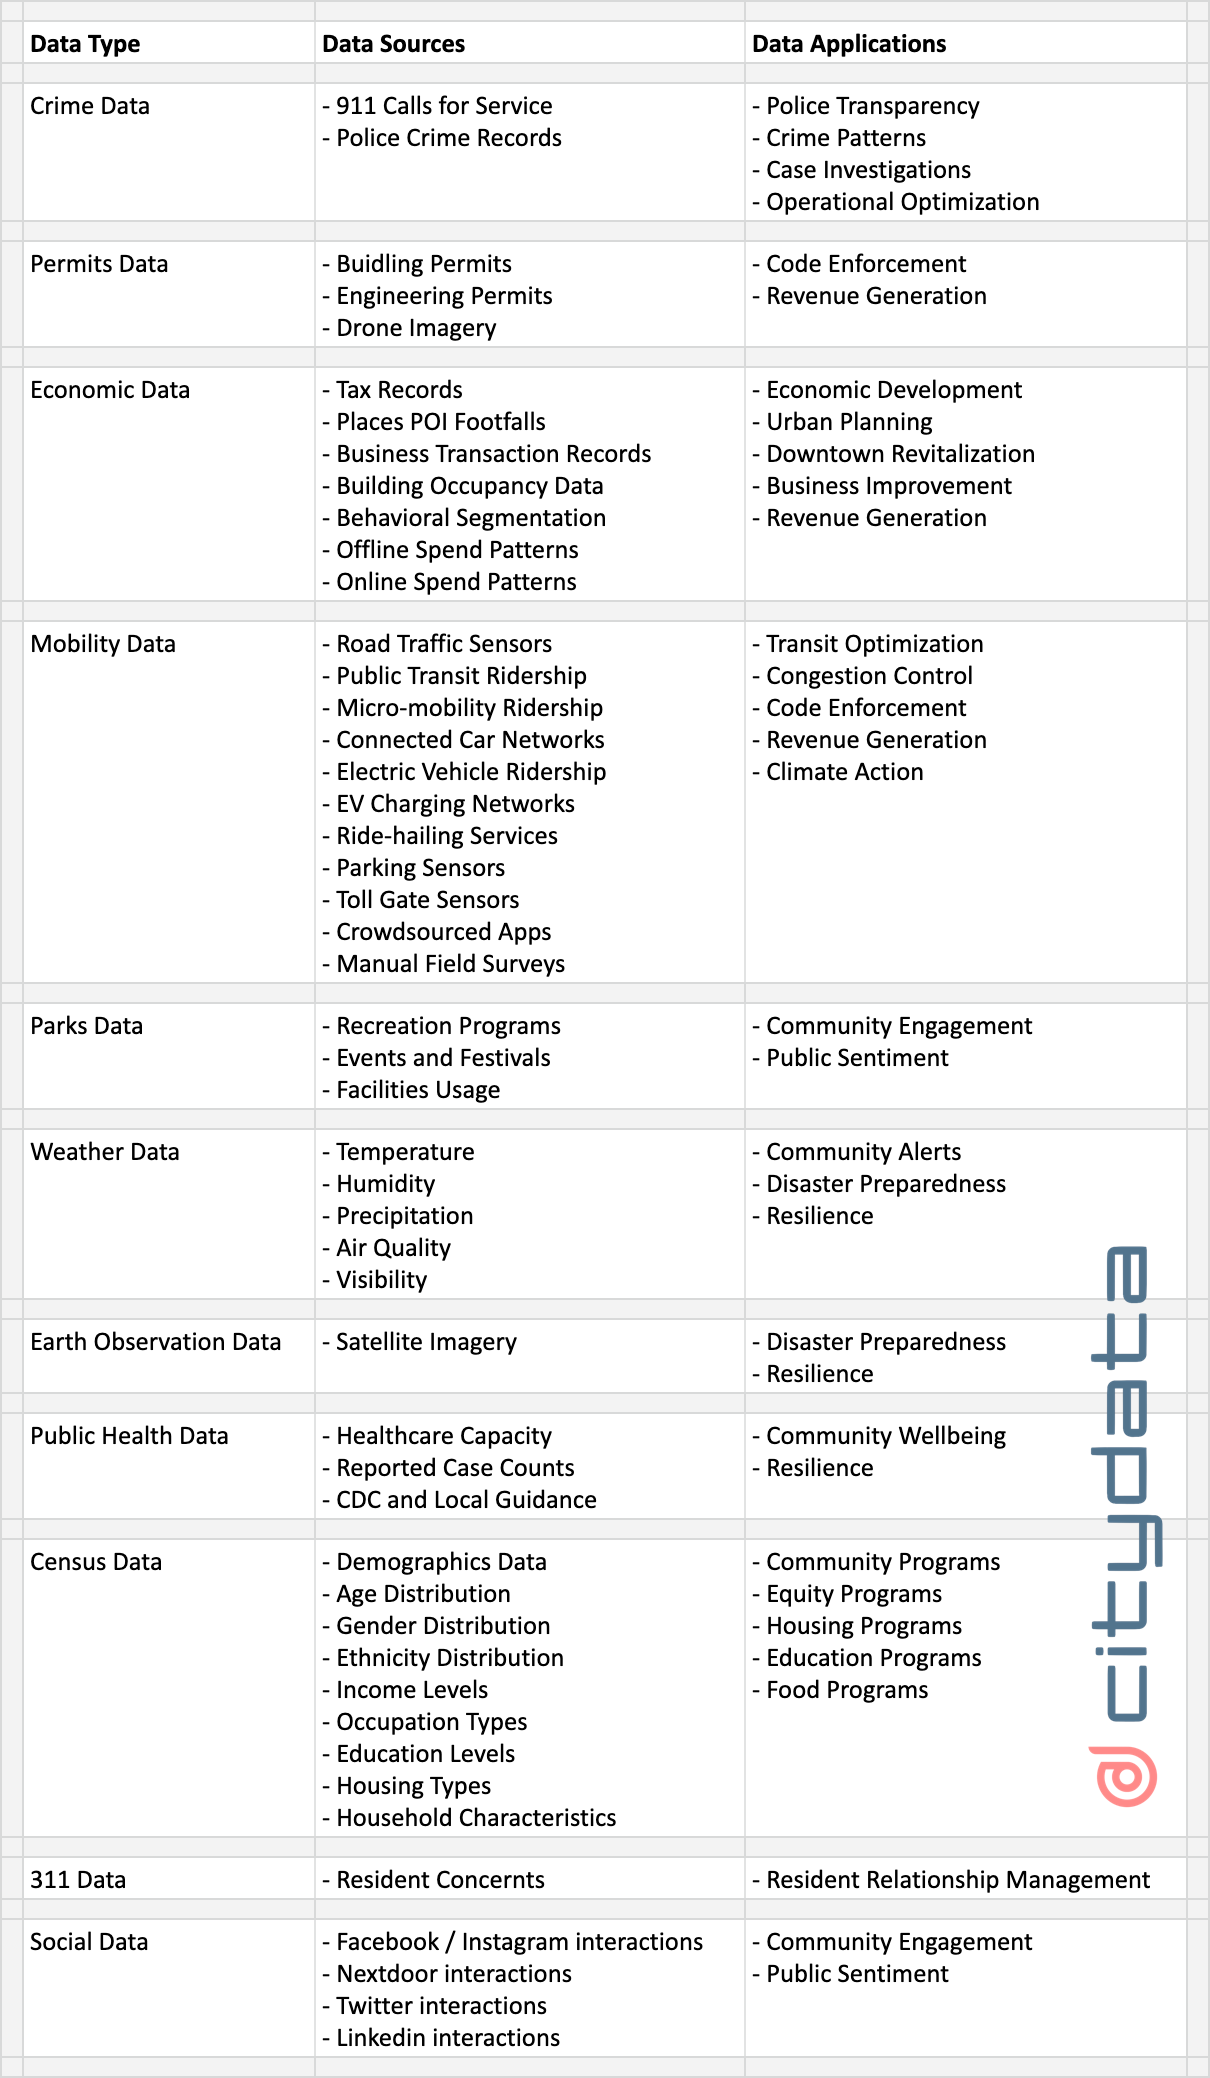
CITYDATA.ai has researched the sourcing, application, and usage of data within government agencies across US cities and counties as well as international cities and states. Based on our extensive experience with data + Ai for the public sector, the below table highlights the common types of data collected by local government agencies and how such data can be harnessed to improve the lives of residents.
Data is only as good as the insights generated from it. By joining datasets and applying machine learning, cities can unearth meaningful insights. The six scenarios listed below highlight some of the types of questions that could be answered using smart data joins and training ML models using a combination of public, open, and proprietary datasets.
Data Challenge:
What are the top 3 resident concerns in the city based on 311 calls, chatbot sessions, and website feedback? Which agencies within the city are lagging in their 311 ticket closure rate? What categories are staying open the longest? Does public sentiment fluctuate with aging tickets?
Datasets Required:
1. Census block shapes and district shapes for the city
2. Census demographic open data with block-level granularity
3. 311 data stream combined across channels like websites, chatbots, call centers
4. City's internal agency roles and responsibilities map relative to 311 tickets
5. Social media data stream from the City's social media accounts
6. Historical weather patterns data, temperature, humidity, precipitation, visibility
General Approach:
Cities receive an enormous amount of resident feedback every day across a variety of digital channels. Ranking the city's daily 311 data stream to find the top concerns can be achieved with a straightforward query against the entire dataset. Aggregating or grouping the concerns using predefined classifications can shed light on the top categories ranked by the number of 311 tickets within each category. Similar aggregations could be performed to rank the categories based on the number of open tickets, active tickets, or closed tickets. Joining the city's 311 datasets with the city's internal map of agency roles and responsibilities makes it possible to identify and recognize the agencies or individuals that are performing within their service level agreements. A simple internal dashboard could be set up to geospatially map the problem areas and sort the data by aging tickets and agency response time. Visual indicators could be set up to aid the teams that are taking the longest to address 311 concerns and close tickets. By curating such datasets over a period of 12 to 24 months, applying geospatial analysis, adding census demographic correlations, and accounting for the influence of local weather, it is possible to build and train models using machine learning to predict the seasonality of resident concerns and assign 311 ticket probabilities for each neighborhood within the city.
Beneficiary Stakeholders:
* IT Directors
* Data Analysts
* City Managers
* District Supervisors
* Public Works & Other Agency Directors
Data Challenge:
Are parks effective in promoting healthy living while also driving the local economy? How many people visited local parks? Did they also frequent local businesses, restaurants, commercial zones, and retail locations? What events and activities should the Recreation & Parks agency focus on to drive more community engagement and increase parks visitation?
Datasets Required:
1. List of all parks and open spaces with shapefiles
2. Parks visits data based on IoT sensors or event attendance
3. Inferred parks visits based on anonymized crowdsourced mobility data such as GPS and wifi, with access to historical archives
4. List of local places, brands, businesses, commercial zones, with shapefiles
5. Inferred footfalls to local businesses based on transaction data or anonymized crowdsourced mobility data such as GPS and wifi, with access to historical archives
6. List of events, activities, programs managed by the Parks and Recreation agency
7. Historical weather patterns data, temperature, humidity, precipitation, visibility
8. Historical air quality data, pollution level, and pollen level
General Approach:
Analyzing the visits to parks and open spaces can provide simple yet powerful insights into how many people visit parks, what are the trends by the hour of the day, what are the patterns by the day of the week, how do visits to parks vary from weekdays to weekends, how do visits fluctuate with changes in weather patterns. In some cases, it might be possible to also infer how long do people on average stay within parks and how often do they visit the same park. Such patterns can be a strong indicator of a community's lifestyle preferences. If the data showed that 65% of the community visited local parks at least three times each week with an average visit duration of 60 minutes, we would know that the majority of that community is likely exceeding the CDC's recommendation of 150 minutes of physical activity per week. Such data insights are an indicator of the general health, well-being, immunity levels, and resilience of the community. By defining the influence of each park through weighted Voronoi cells or Theissen polygons, it is possible to correlate the visits to local businesses in the vicinity of each park. The visits to local businesses could be classified as organic visits or stimulated visits driven by special events and programs. Economic indicators that quantify the impact of each park on the local economy could be essential for prioritizing and allocating operational resources and renovation budgets for the parks system.
Beneficiary Stakeholders:
* Parks & Recreation Directors
* Economic Development Directors
* Public Health Supervisors
* Public Works Directors
* Data Analysts
Data Challenge:
What crime categories and service calls have been trending up in the past three months? What are the demographic, income, occupational characteristics of high-crime neighborhoods? Does the built environment influence crime? Does the crime rate spike in neighborhoods with construction projects? Is there a correlation between crime, weather patterns, major holidays?
Datasets Required:
1. Census block shapes and district shapes for the city
2. Census demographic open data with block-level granularity
3. Police BEATS with Officer patrol schedules and historical paths
4. PD service calls data stream combined across all channels and call centers
5. Social media data stream from the City's social media accounts
6. Historical weather patterns data, temperature, humidity, precipitation, visibility
General Approach:
Per crime pattern theory, crimes occur when the activity space of a victim or target intersects with the activity space of an offender. A person's activity space consists of locations or nodes in everyday life, for example, home, work, school, shopping areas, entertainment areas, and the personal paths that connect these daily nodes. Crime involving an offender and a victim or target can only occur when the activity spaces of both overlap. Such overlaps could be influenced by places or areas within the built environment where overlaps occur more frequently, like shopping malls parking lots, or transit stations. A relatively simple query against the city's police service calls data stream can identify the top categories of calls and infer the general trend of crime in the city. Aggregating or grouping the calls using predefined or dynamic classification can shed light on the number of records related to crimes against persons, crimes against property, organized crimes, and hate crimes. Curating such datasets over a time range of 24 to 60 months, applying geospatial analysis, and adding census demographic correlations, makes it possible to understand the age, income, wealth, occupation, ethnicity, housing size, and household characteristics of neighborhoods with high crime rates, and to find commonalities across such areas within the city, the county, and the state. Analyzing the patrol paths of police cars over time could identify gaps or blind spots that might need to be addressed. Adding the influence of local weather, ingesting data about the built environment, construction projects, building occupancy rates, shopping malls, theaters, museums, local businesses, it becomes possible to build and train models using machine learning to predict the seasonality of crime and infer patterns of influence within each neighborhood.
Beneficiary Stakeholders:
* Mayors
* Police Chiefs
* City Managers
* PD Data Analysts
* District Supervisors
Data Challenge:
Are the slow streets program a success? Was there a significant increase in the number of pedestrians, bicyclists? Did that result in a proportionate increase in visits to local businesses in the area? Were commuters adversely impacted because they had to drive around the slow streets? Was the impact suffered more by the residents of equity zones and low-income neighborhoods?
Datasets Required:
1. List of all slow street corridors with exact shapefiles
2. Start dates, policy adjustment dates, and end dates for slow streets
3. List of events, activities, programs within the slow street corridors
4. Census block shapes and district shapes for the city
5. Census demographic open data with block-level granularity
6. Anonymized crowdsourced mobility data such as GPS and wifi, with access to historical archives
7. Traffic data from traffic sensors with categorized vehicle counts
8. Inferred footfalls to local businesses based on transaction data or anonymized crowdsourced mobility data such as GPS and wifi, with access to historical archives
General Approach:
Slow streets are corridors designated as shared spaces for pedestrians, bicycles, scooters, wheelchairs, and car traffic. On slow streets, vehicles are limited to only local access trips and are encouraged to drive slowly to make the street safer for other users. During the peak pandemic in 2020 and 2021, slow street programs were enforced across many cities. In some cases, the programs completely shut out car or vehicular traffic. In other cases, partial access was approved for cars and vehicles only during weekdays from 9.00 am to 5.00 pm. By mapping the slow streets, correlating with crowdsourced mobility data and traffic count data, and applying geospatial analysis to the combined dataset, it is possible to understand the movement patterns of people within the slow street perimeters and beyond. Such analyses can output the number of people visiting slow streets, the average duration for each visit, the overall trend by the hour of the day, by the day of the week, by weekdays versus weekends. It is also possible to infer the modality of movement such as on-foot, on-bicycle, on-electric-scooters, with some room for error. Long-range analysis that takes into account time periods before and after the slow streets program can quantify the success of the program by measuring key performance indicators like increase in pedestrian activity, increase in bicyclists, reduction in noise pollution, increase in activity levels resulting in improved health, wellbeing and higher overall satisfaction within the community. The visits to local businesses within and around the slow streets could be classified as organic visits or stimulated visits driven by special events and programs. Tracking the visitation patterns over time can also reveal the effectiveness of the slow streets program in influencing footfalls to the local businesses and driving the local economy.
Beneficiary Stakeholders:
* Parks & Recreation Directors
* Transportation Directors
* Urban Planners
* Data Analysts
Data Challenge:
Are businesses in the downtown district performing to the same levels as January 2019 or January 2020? How many people are visiting downtown? What are the trends by the hour and by the day? Where are these people visiting from?
Datasets Required:
1. Downtown zone definition with exact shapefile
2. Commercial zone definitions with shapefiles
3. POI data for places, brands, businesses, with shapefiles
4. Census block shapes and district shapes for the entire city
5. Census demographic open data with block-level granularity
6. Definitions for the host county and all adjacent counties with shapefiles
7. Anonymized crowdsourced mobility data such as GPS and wifi for the entire region, with access to historical archives
8. Inferred footfalls to local businesses based on transaction data or anonymized crowdsourced mobility data such as GPS and wifi, with access to historical archives
General Approach:
Downtown zones, business districts, and commercial zones were adversely impacted in the second half of 2020 and all through 2021. With the reopening of the economy, it became imperative for municipalities and downtown associations to measure the performance of their downtown zones. By quantifying the changes in visitation patterns over time, cities could estimate the health of the micro-economy in their business districts. Filtering and analyzing the crowdsourced mobility data using the shape definitions of downtown or commercial zones can provide deep insights about the footfalls patterns, trends by the hour of the day, weekdays, weekends, and holidays. "Where do people come from?" is the most common question posed by downtown associations, city managers, and public health officials. By analyzing mobility data over a broad geospatial scope that includes all neighboring counties or perhaps even all counties within a 200-mile radius which represents an approximate drive time of 3 hours, it is possible to understand the movement patterns of people visiting the downtown core, what census blocks within the city do they come from, what other cities or counties do they visit from. Adding census demographic correlations to the geospatial models can unveil the visitation trends across age, income, wealth, occupation, ethnicity, housing size, household characteristics, and other socio-demographic attributes.
Beneficiary Stakeholders:
* Downtown Association Directors
* Economic Development Directors
* Urban Planners
* Data Analysts
Data Challenge:
How can the city reduce congestion while also increasing toll revenue? Do last-mile mobility services like scooters and e-bikes help to reduce congestion? Is electrification reducing pollution? What are the best locations to install EV charging stations? If cars indeed were to fly, how should the airspace get allocated for urban air mobility? What are the ideal sites for vertiports? How is road safety impacted by such policies? And are there any policies defined for air safety yet?
Datasets Required:
Such an analysis would require way too many datasets to list in this blog post.
General Approach:
Green mobility is perhaps the most pivotal topic of our generation, fully deserving of a dedicated blog post. Would all mobility operators, public sector, private sector, research organization, and academia need to collaborate to bring about a seismic shift in mobility and transportation? Hint: the answer is yes, but you will need to wait until our next post to read our opinions and predictions.
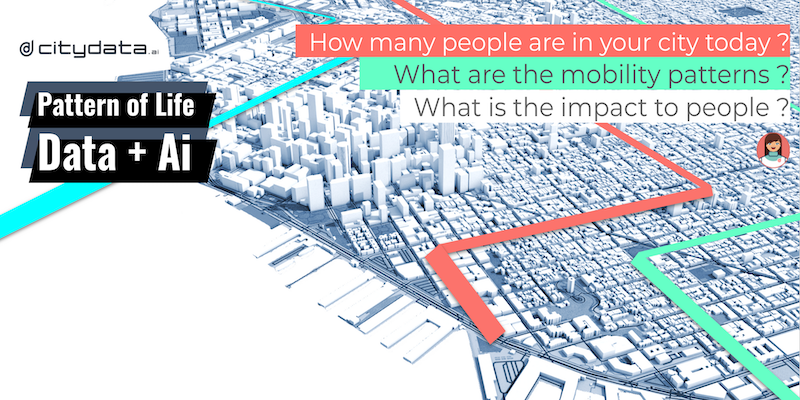
CITYDATA.ai provides pattern-of-life mobility data + Ai for smart cities. CITYDATA knows the answers to the questions “how many people are in your city today” and “what are their movement patterns?”.
CITYDATA offers five main data-as-a-service products:
Founded in 2020 in San Francisco, California, CITYDATA provides fresh, accurate, daily insights that are essential for smart city programs, economic development, urban planning, mobility and transportation, tourism, disaster impact analysis, sustainability, and resilience.
You can reach the company via email at business@citydata.ai if you’d like to discuss your data needs and use cases. You can also follow the company on Linkedin, Twitter, Facebook, YouTube, and the UniverCity.ai blog to stay updated on the newest innovations in mobility data + Ai.