Celebrating Our Fifth Consecutive GovTech 100 Win
We are thrilled to announce that we have been named to the GovTech 100 list
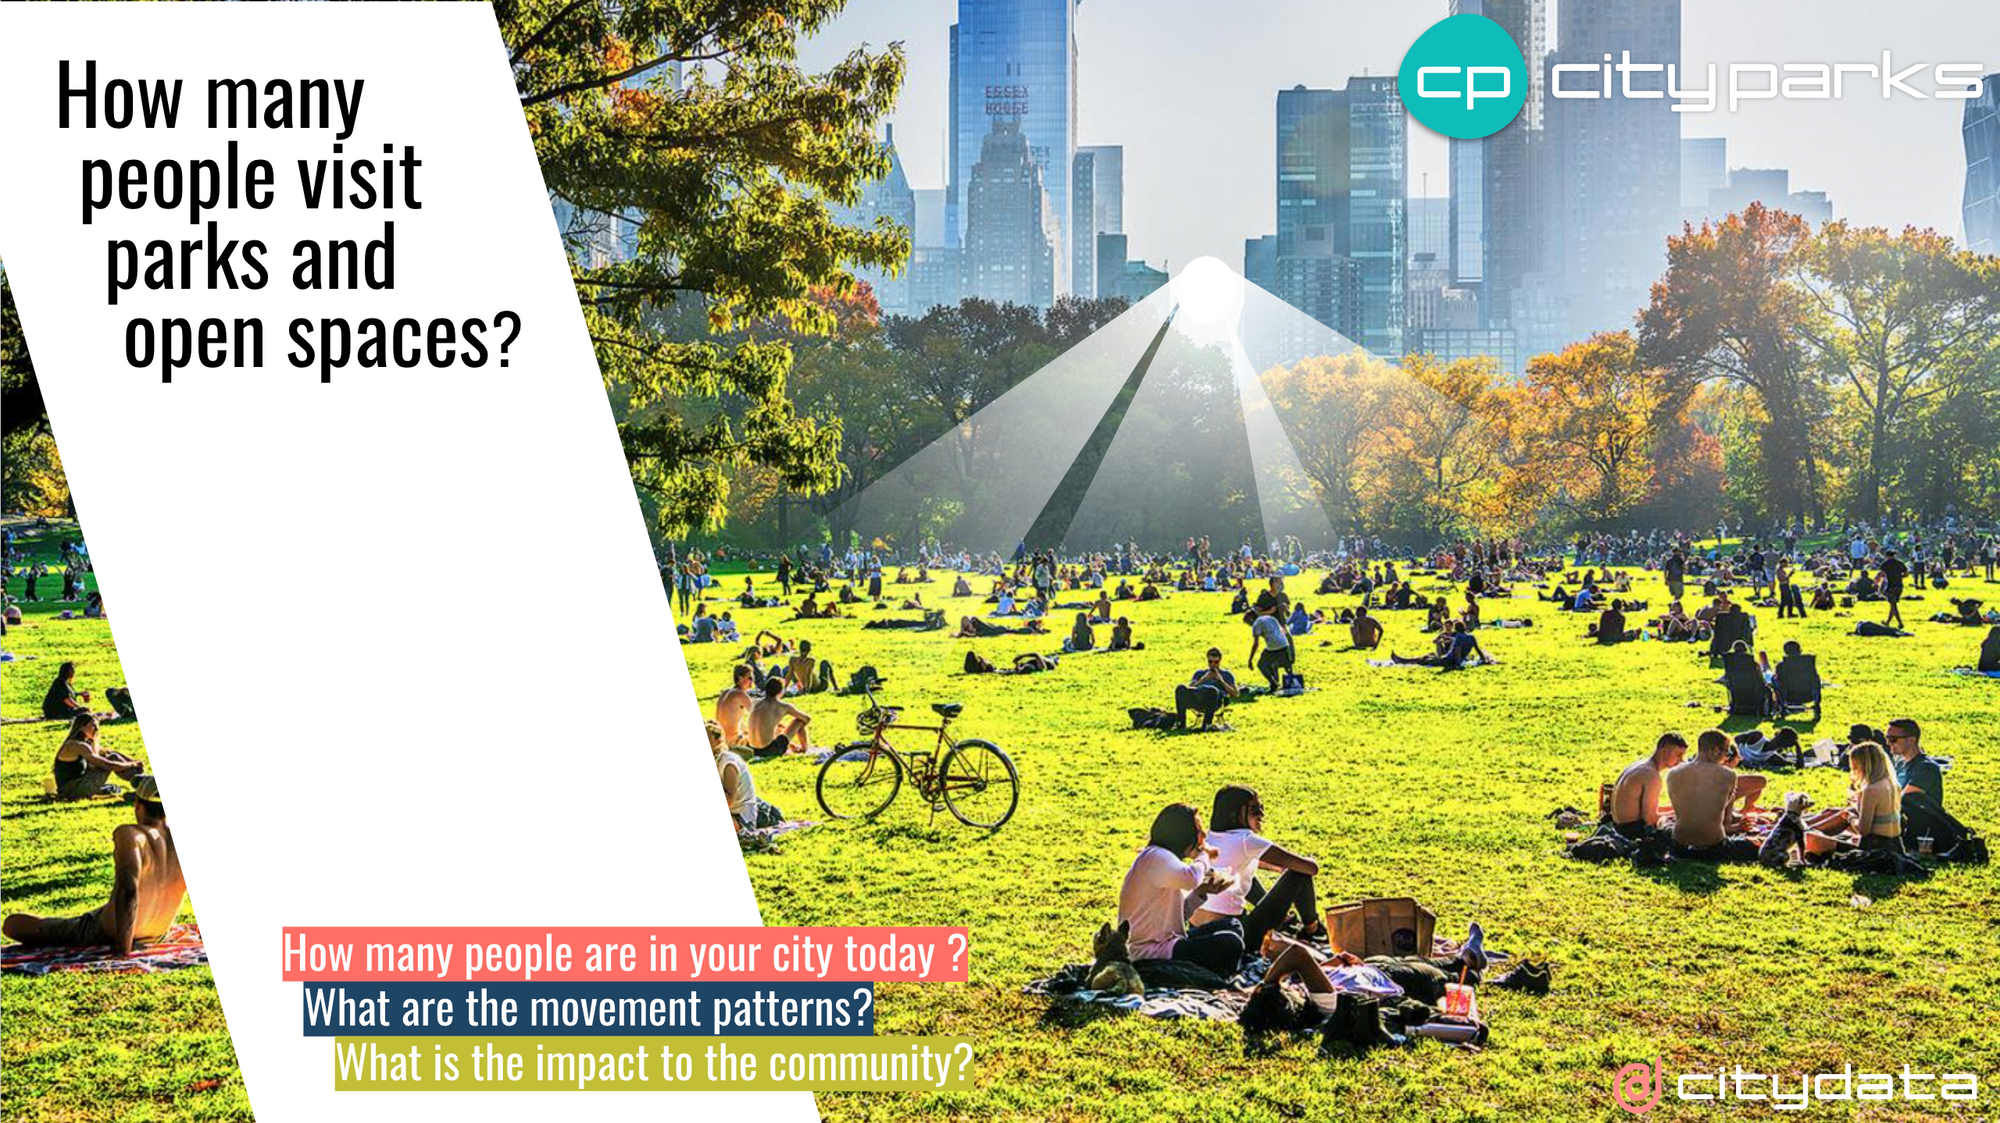
This blog post dives deep into how local government can leverage high-quality mobility big data and AI/ML for inferring visits to parks and open spaces and the dispersion movement patterns
Sign up for our webinars to learn from our data scientists and geospatial experts. They will show you how mobility intelligence can be used in the most cost-effective way to measure and analyze movement patterns.
Get your free consultation here: https://hub.citydata.ai/free-consultation
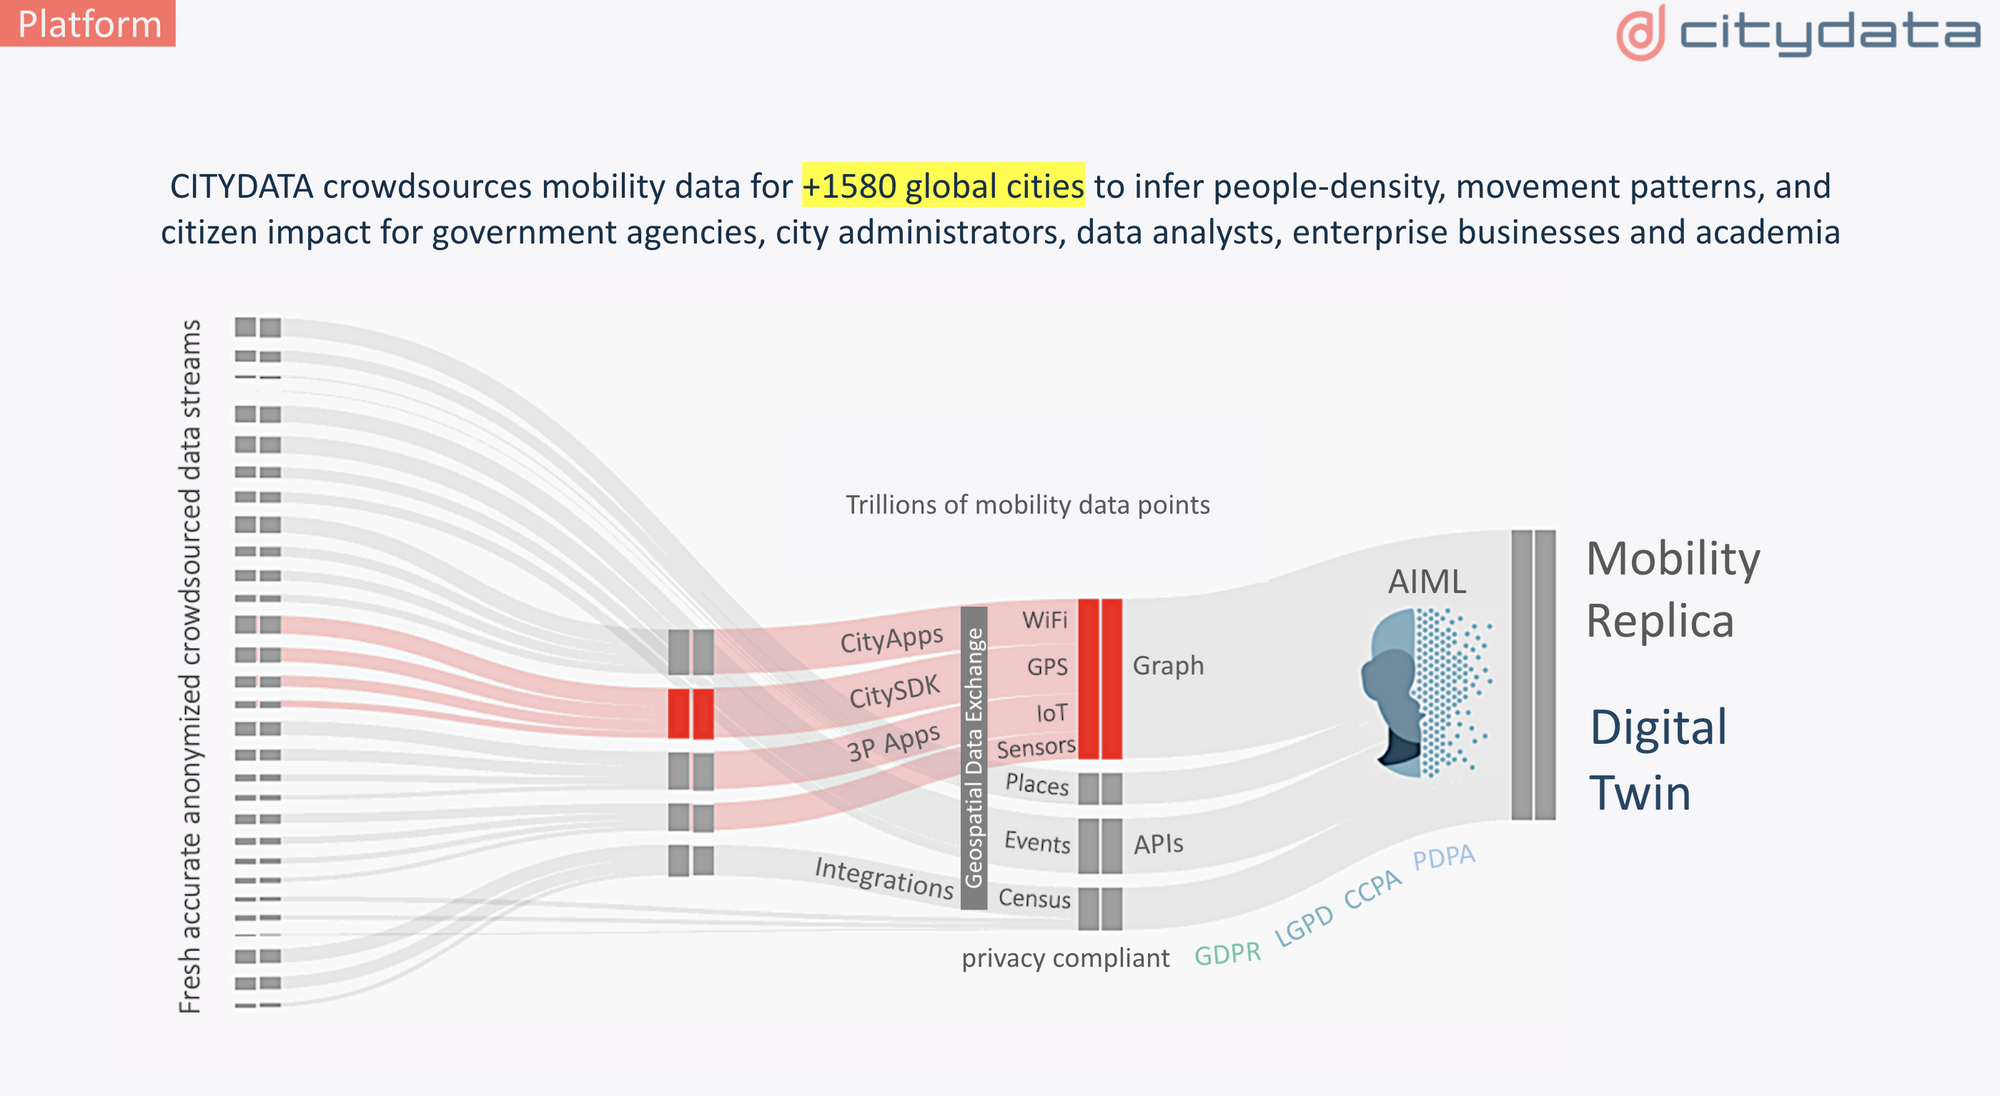
CITYDATA.ai specializes in crowdsourcing anonymized mobility data and aggregating privacy-compliant datasets to infer the footfall visits, the average dwell time, the dispersion or movement patterns, and the changes over time both at the micro and macro level. In doing so, CITYDATA.ai builds mobility replicas or mobility digital twins that represent the chronological historical patterns for people-presence, density, and movement for POI places and geofenced polygons.
Urban-adjacent parks offer endless opportunities for recreational activities in proximity to cities and towns. With the COVID-19 variants still prevalent, people eager to vacation safely are turning to urban-adjacent parks to enjoy large outdoor areas that would allow for physical distancing. Per the CDC, being physically active is one of the best ways to keep the mind and body healthy. In many areas, people can visit parks, trails, and open spaces as a way to relieve stress, get some fresh air and vitamin D, stay active, and safely connect with members of their community. While the number of people visiting parks dropped significantly during the first wave of the pandemic; the visits started to increase as the country began to recover from COVID-19.
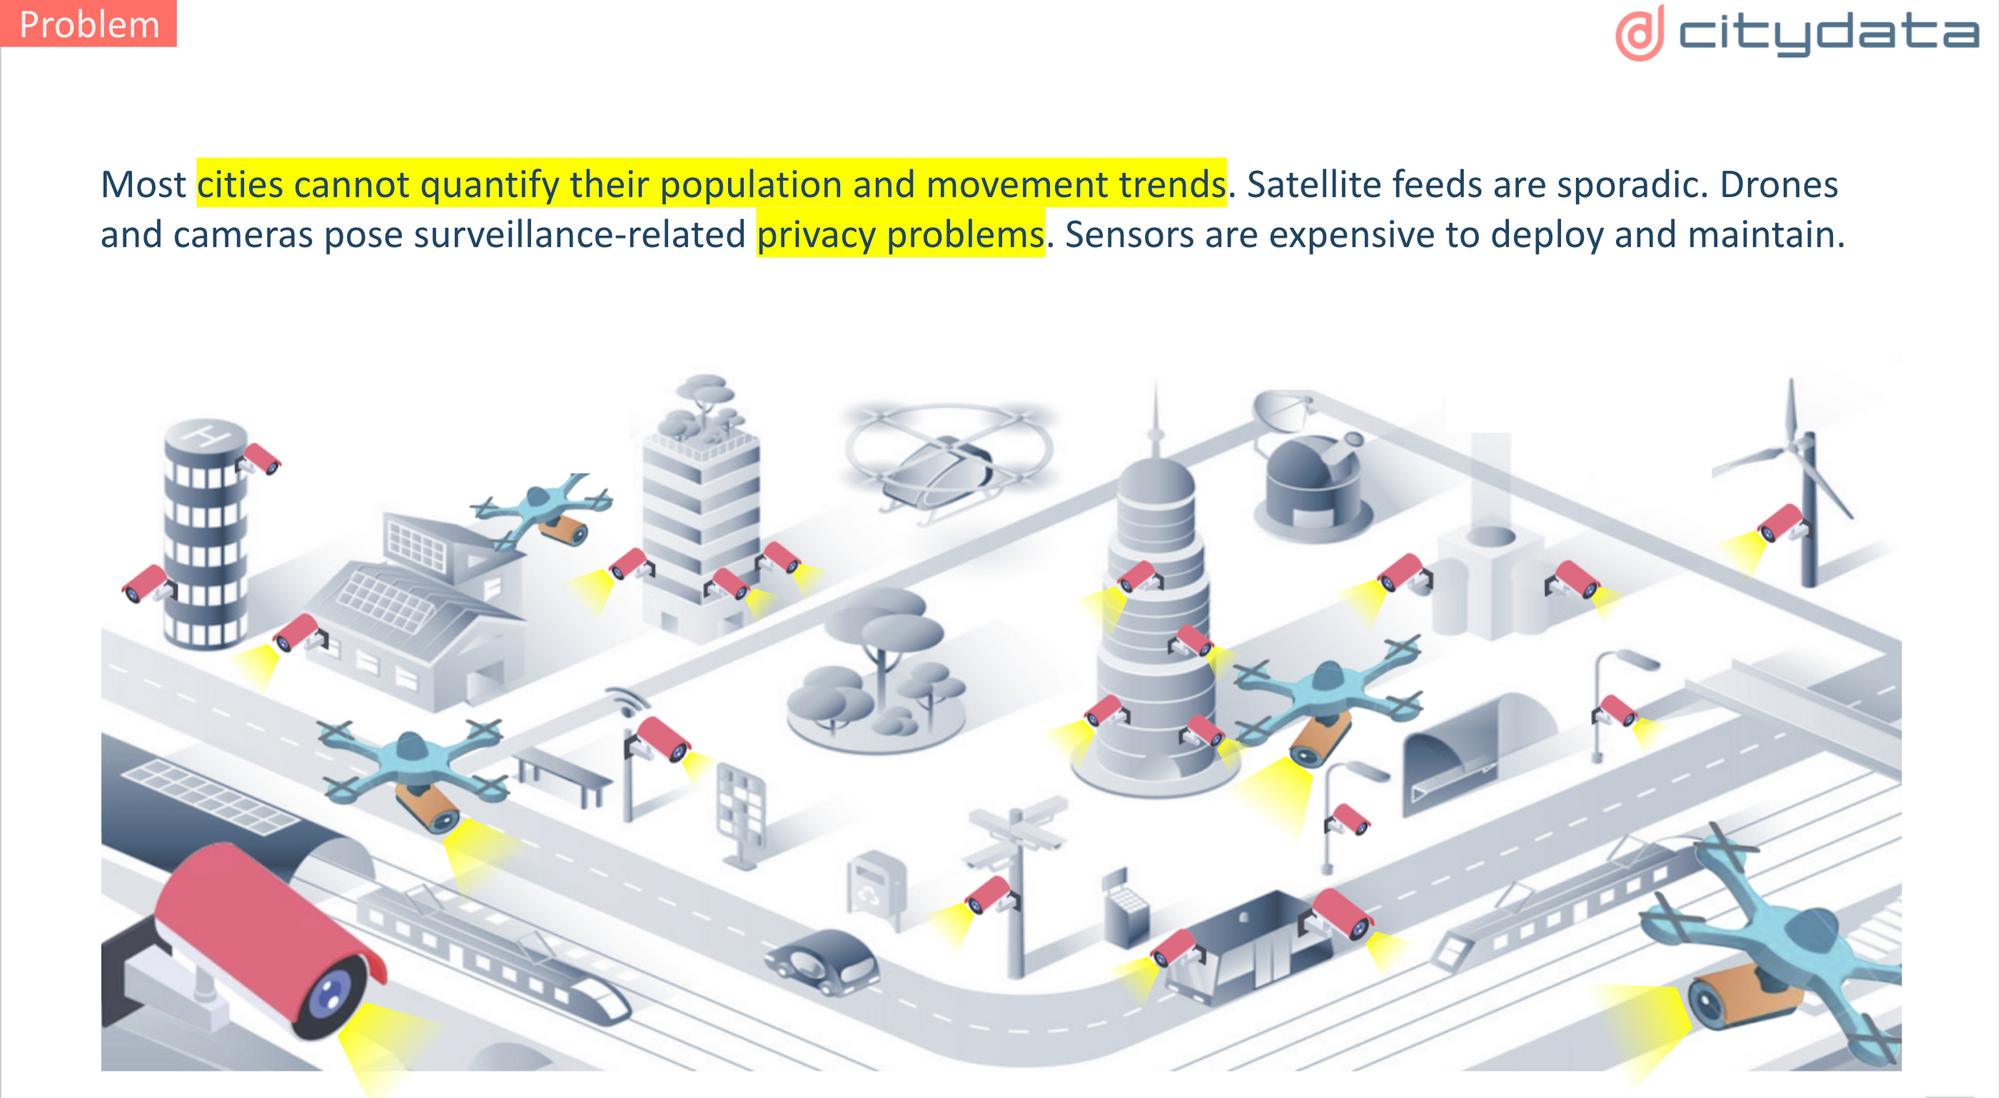
Most cities need to quantify their population and movement trends to make informed data-driven decisions for planning and budgeting. Satellite feeds are sporadic and cannot be relied on for continuous data. Drones and cameras pose surveillance-related privacy problems. Sensors can be expensive to deploy and onerous to maintain.
Google had previously published its Community Mobility Index to measure the high-level aggregated activity at parks and open spaces across the United States. While such reports were useful for understanding the overall trend within a county, the data was not available for individual parks. The high-level data has since been discontinued.
Mobility intelligence companies like CITYDATA.ai are publishing their open datasets and footfall visit insights for each neighborhood park, urban-adjacent park, regional park, and national park in the country. The crowdsourced data samples are statistically relevant and invaluable for the Recreation and Parks departments. Such studies are also essential for public health officials, economic developers, urban planners, and local administrators for their policy decisions.
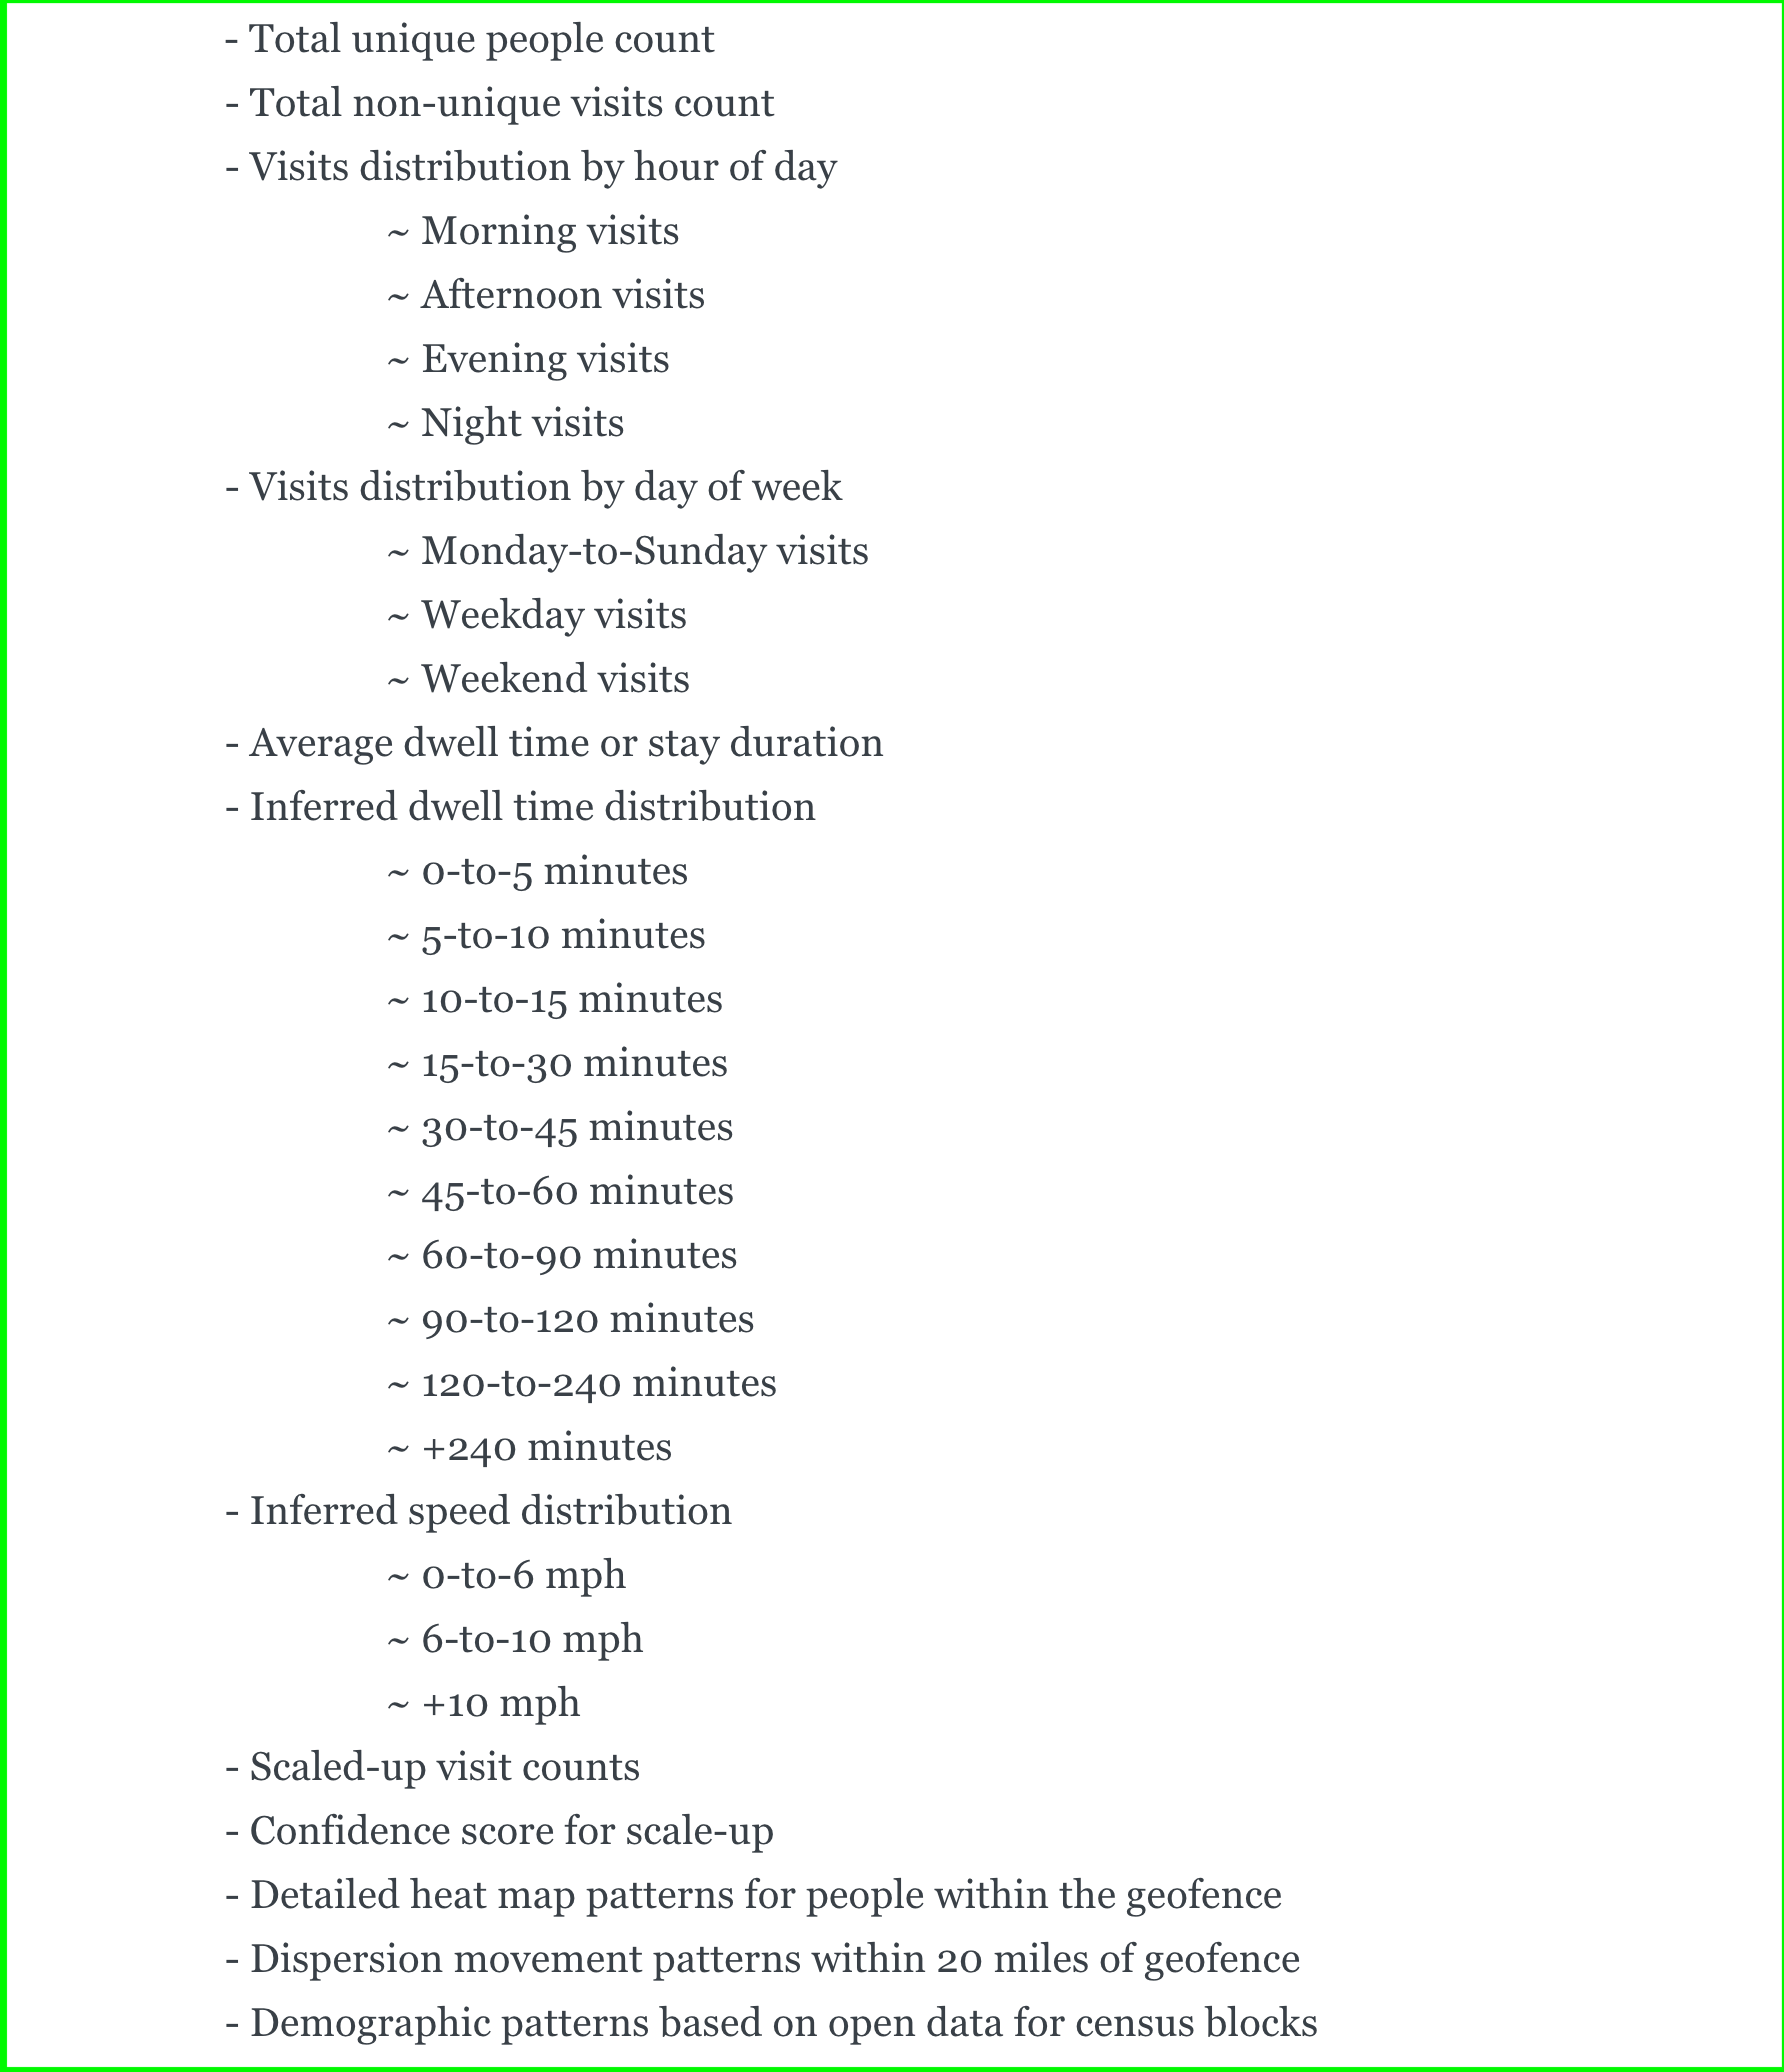
CITYDATA.ai measured the density, activity, and movement of people at urban-adjacent parks, open spaces, campgrounds, and hiking trails that are adjacent to urban areas to study and understand the changes in footfall visit patterns and activity levels. The typical data processing and machine learning pipeline consists of the steps outlined below:
The link below provides a comprehensive list of defined terms related to mobility data and geospatial intelligence: https://univercity.ai/mobility-intelligence-glossary/
The team of GovTech experts at CITYDATA.ai are passionate about geospatial intelligence, mobility patterns, machine learning, and data science for civic use cases. We sincerely believe that our technology platform and our domain expertise can make our cities smarter, safer, more equitable, and liveable. We invite you to partner with us in our quest to build mobility replicas for improving parks and open spaces around the world.
Sign up for our webinars to learn from our data scientists and geospatial experts. They will show you how geospatial intelligence can be used in the most cost-effective way to measure, analyze, and advocate local parks and open spaces.
Get your free consultation here: https://hub.citydata.ai/free-consultation
CITYDATA.ai provides pattern-of-life mobility data + Ai for smart cities. CITYDATA knows the answers to the questions “how many people are in your city today” and “what are their movement patterns?”.
Founded in 2020 in San Francisco, California, CITYDATA provides fresh, accurate, daily insights that are essential for smart city programs, economic development, urban planning, mobility and transportation, tourism, disaster impact analysis, sustainability, and resilience.
You can reach the company via email at business@citydata.ai if you’d like to discuss your data needs and use cases. You can also follow the company on Linkedin, and the UniverCity.ai blog to stay updated on the newest innovations in mobility data + Ai.